Chapter 01 · 2026 · Subscriptions
Subscription winback offers
Which winback offer to send each lapsed subscriber. Assigning offers by churn tenure earned $39K more margin per million reachable users than the better single offer.
- Skills
- Stack
- Python · pandas · NumPy · SciPy · Matplotlib
A team of data scientists at Apple set this challenge. A fictional subscription service ran an A/B test on two offers for users who had cancelled: a free month, or a first month at $0.99. The dataset is synthetic: 180,000 users across four storefronts, split evenly between the two offers.
I led a team of four. We scoped the work as a business decision for a business audience, not a statistics exercise.
Question
The experiment shows which offer gets more signups. The decision needs more than that: which offer makes more money, for which users, and how much it is worth.
Approach
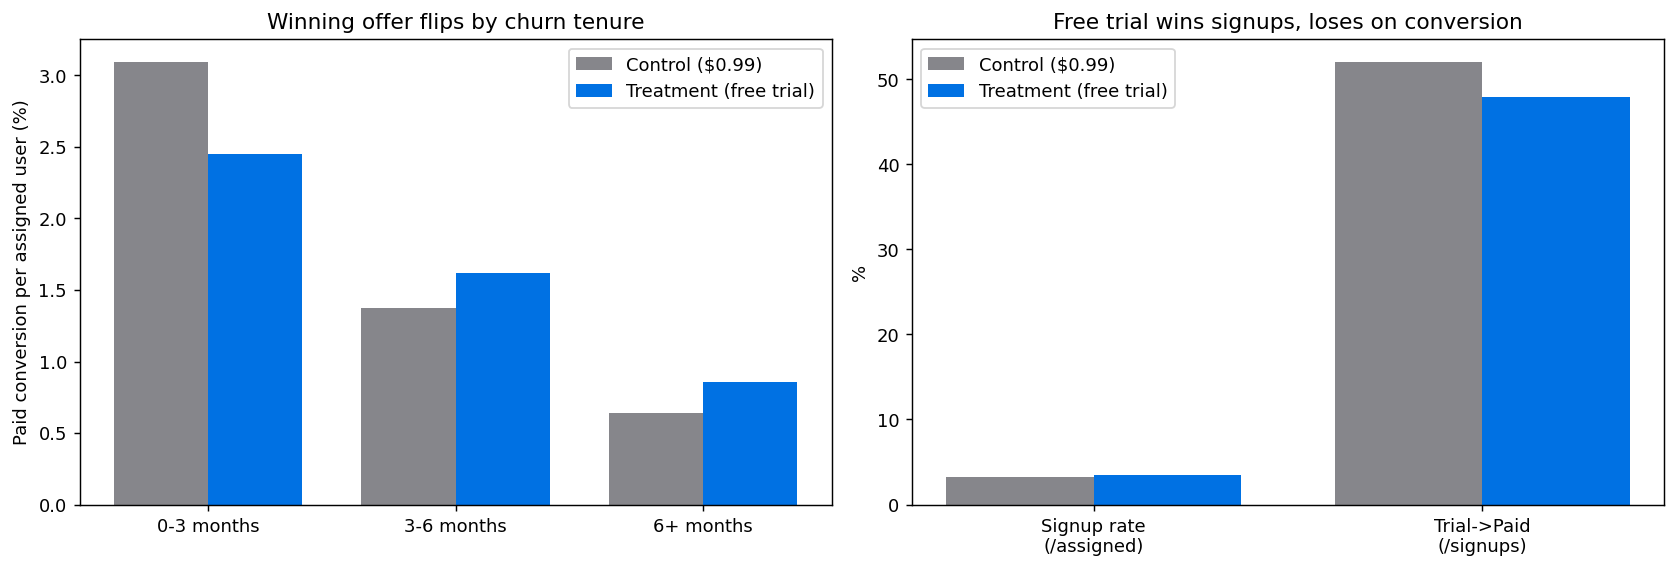
Choosing the metric. Signup rate rewards the more generous offer, so it cannot decide between them. We used paid conversions per assigned user, counted against everyone targeted, including users who never saw the offer. Signup rate, trial-to-paid conversion and click-through became diagnostics that explain movement in that number. Retention is a risk the data cannot measure, because the experiment ends at first payment.
Checking the data. The two arms were balanced at 90,000 users each, and the funnel was intact: no signups without an impression, no paid conversions without a signup. One arm was shown the offer slightly more often (85.2% vs 84.2%), so we compared offers per impressed user and profit per assigned user.
Testing and segmenting. Two-proportion z-tests, overall and within each churn-tenure segment. Tenure separated the offers. Storefront did not (p = 0.26–0.31).
Pricing it. The dataset has no prices or margins, so the dollar figures rest on stated benchmarks: Apple Music’s $10.99 monthly price, Apple Services’ 75% gross margin, and published churn rates. A conversion is valued at six months of contribution margin ($49.46). The cost of an offer is the margin given up on each signup.
Result
| Strategy | Margin per 1M reachable users |
|---|---|
| $0.99 offer for everyone | $597K |
| Free trial for everyone | $531K |
| $0.99 for recent churners, free trial for the rest | $637K |
Recommendation: send the $0.99 offer to users who cancelled within the last three months and the free trial to everyone else, starting with a pilot.
What the model left out
After the presentation, a product manager asked three questions the profit figure does not answer. Customers shown different offers may compare them. A gain for the growth team can cost another team a metric it is measured on. And part of the gain may come from users who would have come back anyway.
None of these were in the model. They change how the recommendation should be carried out: as a monitored pilot that tracks all three, not a rollout based on the margin figure alone.
Limits
- Retention is unmeasured. The six-month value assumes converted users stay, and the data cannot confirm it.
- The data is synthetic and the benchmarks come from other services, so the figures are an order-of-magnitude estimate.
- The model scales linearly with audience size. In practice, the harder-to-reach users convert less, so the projection is an upper bound.